The schedule is out 🗓️ for POSETTE: An Event for Postgres 2026!
This post by Jelte Fennema was originally published on the Microsoft TechCommunity Blog.
Update in October 2022: Citus has a new home on Azure! The Citus database is now available as a managed service in the cloud as Azure Cosmos DB for PostgreSQL. Azure documentation links have been updated throughout the post, to point to the new Azure docs.
My main advice when running performance benchmarks for Postgres is: "Automate it!"
If you're measuring database performance, you are likely going to have to run the same benchmark over and over again. Either because you want a slightly different configuration, or because you realized you used some wrong settings, or maybe some other reason. By automating the way you're running performance benchmarks, you won't be too annoyed when this happens, because re-running the benchmarks will cost very little effort (it will only cost some time).
However, building this automation for the database benchmarks can be very time-consuming, too. So, in this post I'll share the tools I built to make it easy to run benchmarks against Postgres—specifically against the Citus extension to Postgres running in a managed database service on Azure called Hyperscale (Citus) in Azure Database for PostgreSQL.
Here's your map for reading this post: each anchor link takes you to a different section. The first sections explore the different types of application workloads and their characteristics, plus the off-the-shelf benchmarks that are commonly used for each. After that you can dive into the "how to" aspects of using HammerDB with Citus and Postgres on Azure. And yes, you'll see some sample benchmarking results, too.
Why dive into the background on different workloads and database benchmarks first? Because there's something that's even more important than automating the way you run performance benchmarks: Choosing the right benchmark for you!
- Different benchmarks for different workloads
- Benchmark specifications vs full benchmark suites
- OLTP workloads
- OLAP workloads
- HTAP workloads
- Dangers of comparing benchmark results
- HammerDB TPROC-C
- How to benchmark Citus with HammerDB, ARM, Bicep, and cloud-init
- Getting to 2.0 million NOPM with larger Citus database clusters on Azure
- Have fun benchmarking your database performance
Different types of benchmarks for different types of workloads
Everyone that is using a database is using it for a different workload, because everyone has a different dataset and is running different queries. So, when comparing database performance, you will get the most accurate results by running a benchmark that's based on your own workload. However, preparing a completely custom benchmark can be quite a bit of work.
So instead, you will likely want to run an off-the-shelf benchmark with a workload that is very similar to your own.
Benchmark specifications vs. full benchmark suites
There are two different ways in which an off-the-shelf benchmark can be provided to you:
- Benchmark specification. In this case it is described how to run the benchmark in a document. It will tell you how to prepare the tables, how to load the data, and what queries to run. But you're expected to do all this manually.
- Full benchmark suite. In this case an application is provided to you which will run the benchmark. You configure the benchmarking application to run against your database server—and once it's done running it spits out a few numbers to indicate how good the run was.
It's obvious that a full benchmark suite is usually what you want since you can simply start the benchmarking application and get results. If you only have a benchmark specification, then you will first need to write tooling to run this specification against a database.
OLTP (Online Transaction Processing) workloads
A common workload category for databases is called OLTP (Online Transaction Processing). Workloads that fall in the OLTP category send lots of small, short-running queries (or transactions) to the database.
Some characteristics of OLTP workloads are:
- Inserts, updates, and deletes only affect a single row. An example: Adding an item to a user's shopping cart.
- Read operations only read a handful of items from the database. An example: listing the items in a shopping cart for a user.
- Aggregations are used rarely, and when they are used they are only used on small sets of data. Example: getting the total price of all items in a user their shopping cart.
The type of applications that create such a workload often have many concurrent users, that in aggregate do many requests per second. So for OLTP workloads, it's important that the database can handle quite a lot of these queries at the same time. Response time of the application is usually also important, so the database queries should not take very long to run. Queries should always complete in less than a ~5 seconds, and most queries should complete in less than 100ms and probably even faster.
Well known database benchmarks that fall in the OLTP category are YCSB (full suite), TPC-C (specification), and HammerDB TPROC-C (full suite). There are two types of numbers that come out of these OLTP benchmarks that people are usually interested in:
- Throughput in TPS (transactions per second)
- Query latency, usually at different percentiles (p95, etc.)
OLAP (Online Analytical Processing) workloads
Another common database workload is called OLAP (Online Analytical Processing). This is the type of workload that is often run on data warehouses.
Some characteristics of OLAP workloads are:
- Periodic batch inserts of data. New data is often added to the database from other systems in batches. This is usually done at specific times of the day when the database is not used by users, such as midnight in the local timezone.
- Read operations often read large parts of the database. Common reasons for this are to answer questions from business analysts or have results that can be shown in quarterly shareholder meetings. A few examples of questions that require:
- What are the top 10 most sold products of the last year?
- How many new customers have joined in the last month?
- How much revenue was generated by returning customers?
- Aggregations are used in almost every query. Given that read operations read large parts of the database aggregations are necessary to make this data digestible by humans.
- Queries are large and complex. To answer queries data often needs to be gathered from multiple different tables, or data needs to be compared to different data within the same table. The queries to gather and combine this data often use many of the features of SQL in a single query, such as JOINs, CTEs, subqueries, and window functions. Because they combine so many features, OLAP queries often become quite large and complex.
As opposed to OLTP, there are usually not a lot of concurrent users in an OLAP system. Usually only a single query—or only a few queries—are running at a time. Response times of these queries are also a lot higher than for OLTP workloads. OLAP queries usually take multiple seconds, or even minutes to complete. But of course database response times are still important in OLAP workloads, and waiting more than 20 minutes for a query result is often unacceptable.
Well known benchmarks that fall in the OLAP category are TPC-H (specification), TPC-DS(specification) and HammerDB TPROC-H (full suite). These benchmarks have a set of queries that use various SQL features and have different levels of complexity and number of JOINs.
There are two different results that an OLAP benchmark can give you:
- How long it took to run all of the queries that are part of the benchmark
- How long it took to run each of the queries, measured separately per query
HTAP (Hybrid transactional/analytical processing) workloads
Another database workload category is called HTAP (Hybrid transactional/analytical processing). This category contains workloads that combine aspects from both OLTP and OLAP workloads. So, there will be lots of active users doing small transactions, while at the same time running a few heavy long-running queries.
There's only one well-known database benchmark that falls in the HTAP category and this benchmark is CH-benCHmark (specification). The CH-benCHmark benchmark specification describes running an OLTP benchmark (TPC-C), while also executing some queries from an OLAP benchmark on the same database. Creating a custom HTAP benchmark yourself is also possible, by running both an OLTP benchmark and an OLAP benchmark of your choice at the same time.
Challenge with benchmarking HTAP workloads
It can be quite hard to compare the numbers that come out of an HTAP benchmark across runs. This stems from the fact you will get two numbers per run of the benchmark and these numbers are often show an inverse correlation:
- Throughput in TPS (transactions per second) for the OLTP part
- Time it takes to run the analytical queries in seconds for the OLAP part
The problem is that as the number of transactions per second rises, the analytical queries will take longer to run. In other words, when TPS increases (good), then OLAP queries takes longer (bad). There are two reasons for this:
- More TPS will often mean that the resources of the machine (cpu/disk) are more busy handling the OLTP queries. This has the side effect that these resources are available less often for the OLAP queries to use.
- A certain percentage of OLTP transactions will insert data into the database. So higher TPS, means that the amount of data in the database will grow faster. Which in turn means that the OLAP queries will have to read more data, thus becoming slower.
The inverse correlation between these numbers makes it hard to conclusively say if one HTAP benchmark run has better results than another. You can only conclude that one is better if and only if both numbers are better. If one of the numbers is better, while the other is worse, then it becomes a matter of tradeoffs: It's up to you to decide what you consider the most important factor for your workload: the number of OLTP transactions per second, or the time it takes to run the OLAP queries.
| OLTP | OLAP | HTAP | |
|---|---|---|---|
| Small short queries insert/update/delete | yes | no | yes |
| Aggregations | no | yes | yes |
| Concurrent users | yes | no | yes |
| High number of concurrent queries | yes | no | yes |
| Fast response times | yes | no | yes |
| Large batch inserts/updates | no | yes | yes |
| Bulk reads | no | yes | yes |
| TopN queries | no | yes | yes |
| Typical benchmarks specifications | TPC-C | TPC-H TPC-DS | CH-benCHmark |
| Typical benchmark suites | YCSB HammerDB TPROC-C | HammerDB TPROC-H |
Dangers of comparing benchmark results you find online
Instead of running benchmarks yourself, it can be tempting to compare numbers published online by others. One thing to be careful of when comparing benchmarks run by others: There are many different ways to configure the benchmarks. So, comparing them is usually apples to oranges. A few of the differences that matter a lot are:
- Is it running on production infrastructure? A lot more performance can usually be achieved when critical production features have been disabled. Things like backups, High Availability (HA) or security features (like TLS) can all impact performance.
- How big is the dataset that was used? Does it fit in RAM or not? Reading from disk is much slower than reading from RAM. So, it matters a lot for the results of a benchmark if all the data fits in RAM.
- Is the hardware excessively expensive? Obviously a database that costs $500 per month is expected to perform worse than one that costs $50,000 per month.
- What benchmark implementation was used? Many vendors publish results of a TPC benchmark specification, where the benchmark was run using a custom implementation of the spec. These implementations have often not been validated and thus might not implement the spec correctly.
So, while it is easiest to compare database benchmark numbers you find online, you probably want to run your own benchmarks with your own data, too.
HammerDB TPROC-C for OLTP workloads
HammerDB is an easy to use open-source benchmarking suite for databases. HammerDB can be used to run an OLTP or an OLAP benchmark. The OLTP one is called TPROC-C1 and is based on the TPC-C specification. The OLAP benchmark is called TPROC-H and is based on the TPC-H specification. HammerDB has implementations of these benchmarks for a lot of different databases, which makes it easy to compare results across different database types.
I have submitted several pull requests to HammerDB to improve the benchmark suite. One of these pull requests makes HammerDB TPROC-C work with the Citus extension to Postgres (therefore with distributed PostgreSQL). Two others greatly improved the speed at which the benchmark data is loaded into Postgres. All my pull requests have been accepted and were released in HammerDB 4.4. So, starting with HammerDB 4.4 you can run the HammerDB TPROC-C benchmark against Citus.
The main number that HammerDB gives you to compare across benchmark runs is called NOPM (new orders per minute). HammerDB uses NOPM instead of TPS (transactions per second), to make the number comparable between the different databases that HammerDB supports.The way that NOPM is measured is based on the tpmC metric from the official TPC-C specification—although in HammerDB, it is called NOPM instead of tpmC, because tpmC is technically used for official, fully audited benchmark results.)
How to benchmark Citus & Postgres on Azure with HammerDB, ARM, Bicep, tmux and cloud-init
Like I mentioned at the start, the most important thing when running benchmarks is to automate running them. In my experience you're going to be re-running (almost) the same benchmark a lot!
That's why I wanted to make running performance benchmarks with HammerDB against Postgres and Citus even easier than HammerDB already does on its own.
So, I created open source benchmark tooling (repo on GitHub)around HammerDB to make running benchmarks even easier—especially for the Citus extension to Postgres, running on Azure. When you use Postgres extensions, there are two layers of database software involved: you are running on both the Postgres database and also on the Postgres extension. So, the open source benchmarking automation I created for Citus runs benchmarks on the Hyperscale (Citus) option in the Azure Database for PostgreSQL managed service.
The benchmark tooling I created uses various things to make running benchmarks as easy as possible:
- ARM templates in the Bicep format are used to provision all of the Azure resources need for the benchmark. It provisions the main thing you need: a Citus database cluster, specifically a Hyperscale (Citus) server group in Azure Database for PostgreSQL. But it also provisions a separate VM that's used to run the benchmark program on—this VM is also called the "driver VM".
- Tmux is used to run the benchmark in the background. There is nothing worse than having to restart a 6 hour benchmark after 5 hours, only because your internet connection broke. Tmux resolves this by keeping the benchmark application running in the background even when you disconnect.
- A cloud-init script is used to start the benchmark. The ARM template for the driver VM contains a cloud-init script that automatically starts the benchmark, once Postgres becomes reachable. That way you can just sit back and relax after you start the provisioning process. The benchmark will automatically start running in the background once the database and driver VM have been provisioned.
At the time of writing, the open source benchmark tooling I created supports running HammerDB TPROC-C (OLTP) and a custom implementation of the CH-benCHmark specification (HTAP). However, even if you want to run a different benchmark, the tooling I created will likely still be very useful to you. The only thing that you'd have to change to run another benchmark should be the section of the cloud-init script that installs and starts the benchmark. Feel free to send a PR to the repository to add support for another benchmark.
Tips about the Citus database configuration
Apart from automating your benchmarks there are a couple of Citus and Postgres related things that you should keep in mind when running benchmarks:
- Don't forget to distribute the Postgres tables! Most benchmarking tools don't have built-in support for distributing Postgres tables with the Citus extension, so you will want to add some steps where you distribute the tables. If possible, it's best to do this before loading the data, that way the data loading will be faster.
- Choose the right distribution column. When distributing tables with Citus, it's important to choose the right distribution column, otherwise performance can suffer. What the right distribution column is depends on the queries in the benchmark. Luckily, we have documentation with advice on choosing the right distribution column for you.
- After building your dataset, run
VACUUM ANALYZEon all your tables. Otherwise, Postgres statistics can be completely wrong, and you might get very slow query plans. - Be sure that your
shard_countis a multiple of the number of workers that you have. Otherwise, the shards cannot be divided evenly across your workers, and some workers would get more load than others. A good defaultshard_countis 48 as the number 48 is divisible by a lot of numbers.
How to use the citus-benchmark tooling to run HammerDB benchmarks
Like I said, I tried to make running benchmarks as easy as possible. So, all you need to do is run this simple command (for detailed instructions check out the README in the "azure" directory):
# IMPORTANT NOTE: Running this command will provision 4 new Citus clusters
# and 4 times a 64-vCore driver VM in your Azure subscription. So, running
# the following command will cost you (or your employer) money!
azure/bulk-run.sh azure/how-to-benchmark-blog.runs | tee -a results.csv
The command above will start running HammerDB TPROC-C on a few different cluster sizes on production infrastructure for Hyperscale (Citus), a deployment option in the Azure Database for PostgreSQL managed service.2 The results of these benchmark runs are all gathered in the results.csv file.
When you look at the newly created results.csv file, you'll see strings that look like, for example, "c4+2w8":
- c4+2w8 : This is simply a short way of saying that the cluster of that run has a 4 vCore coordinator ("c"), and 2 workers ("2w"), both with 8 vCores.
The total amount of cores present in the cluster is also shown in parenthesis.
Now that you have a csv file, you can use Excel (or whatever you prefer) to create a graph that looks roughly like this:
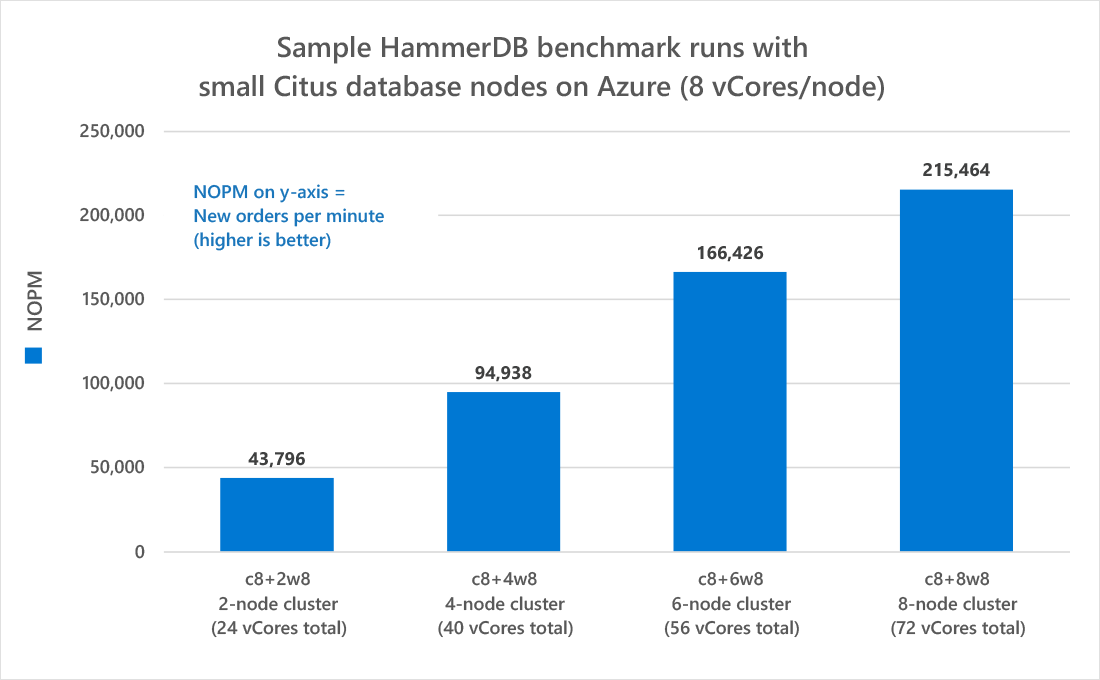
As you can see, NOPM keeps increasing when you add more workers to the Citus cluster. This shows that Citus delivers on the promise of scaling out: By simply adding more Citus nodes to the cluster in Azure Database for PostgreSQL, our performance goes up.
Getting to 2.0 million NOPM with larger Citus database clusters on Azure
The numbers in the graph above were gathered using relatively small Citus clusters. The main purpose of the chart is to show you how easy it is to get these numbers using HammerDB and the open source benchmarking tooling I created.
It's possible to observe much higher benchmark results for Citus on Azure if you increase the number of vCores on each database node, and/or if you increase the total number of worker nodes in the Citus cluster. Higher performance with more vCores can be seen in our paper that was accepted at SIGMOD '21. We used a coordinator and 8 workers with 16 cores and the NOPM in that paper was a lot higher.
Recently we also ran HammerDB TPROC-C on a very big Citus database cluster and got a whopping 2.0 million NOPM, using our regular managed service infrastructure on Azure.3
Some more details about this 2M NOPM HammerDB result:
The Azure Database for PostgreSQL - Hyperscale (Citus) database cluster used for this benchmark had a 64 core coordinator and 20 worker nodes with 32 cores each (so 704 cores in total.)
Apart from using more worker nodes and more vCores per node than the sample run discussed earlier in this post (details in Figure 2 above), there was one other thing that needed to be changed to achieve the 2M NOPM: HammerDB needed to be configured to use a lot more concurrent connections. The earlier sample benchmark runs shown in Figured 2 above used 250 connections, but to keep this big cluster constantly busy I configured HammerDB to use 5000 connections.
The number of connections provided by default for Hyperscale (Citus) server groups in Azure Database for PostgreSQL depends on the coordinator size—and the maximum number of user connections is set by the system at 1000. To increase it, you just need to reach out to Azure support and request an increase in the maximum number of user connections to at least 5000 on Postgres 14—a bit more is better to be on the safe side—for your Hyperscale (Citus) server group. So, creating a Hyperscale (Citus) cluster that can reproduce the 2M NOPM results is just a single support ticket away. After that you can simply use my benchmark tooling to run a benchmark against this cluster.
Have fun benchmarking your database performance
Comparing performance of databases or cloud providers can seem daunting. But with the knowledge and tools provided in this blog, benchmarking the database performance of Hyperscale (Citus) in Azure Database for PostgreSQL should be much easier. When running any performance benchmarks yourself, make sure that you:
- Choose a benchmark that matches your workload. Does your workload fall into the OLTP, OLAP, or HTAP category?
- Automate running benchmarks. ARM, Bicep, tmux, and cloud-init can make running database performance benchmarks a breeze. You can likely even reuse the open source tooling that I wrote!
Have fun benchmarking!
And regardless of whether you're looking to run your app on Citus open source in a self-managed way—or you're looking to run your application on a managed database service on Azure—it's quite easy to get started with Citus to scale out Postgres.
Footnotes
- If you're first hearing of the benchmark name TPROC-C, you might think the "PROC" part of the name is because it uses stored “proc”edures. Not so! Rather, the name for the HammerDB workload TPROC-C means “Transaction Processing Benchmark derived from the TPC “C” specification”. More details here: https://www.hammerdb.com/docs/ch03s02.html. ↩︎
- Postgres 14 and Citus 10.2 were used in this benchmark. All servers had 512GB storage and pgbouncer is not used. HammerDB TPROC-C was configured to run with 1000 warehouses and 250 virtual users. The "all warehouses" setting was turned on. ↩︎
- Postgres 14 and Citus 10.2 were used in this benchmark. All servers had 2TB storage and pgbouncer was not used. HammerDB TPROC-C was configured to run with 5000 warehouses and 5000 virtual users. The "all warehouses" setting was turned on. A few Postgres settings were also changed from the defaults provided by Hyperscale (Citus), some of these require contacting support to change:
↩︎work_mem 16MB max_connections 12000 superuser_reserved_connections 3 citus.max_shared_pool_size 12000 max_prepared_transactions 12100 pg_stat_statements.track none