The schedule is out 🗓️ for POSETTE: An Event for Postgres 2026!
We released Citus 11 in the previous weeks and it is packed. Citus went full open source, so now previously enterprise features like the non-blocking aspect of the shard rebalancer—and multi-user support—are all open source for everyone to enjoy. One other huge change in Citus 11 is now you can query your distributed Postgres tables from any Citus node, by default.
When using Citus to distribute Postgres before Citus 11, the coordinator node was your application’s only point of contact. Your application needed to connect to the coordinator to query your distributed Postgres tables. Coordinator node can handle high query throughput, about 100K per second but your application might need even more processing power. Thanks to our work in Citus 11 you can now query from any node in the Citus database cluster you want. In Citus 11 we sync the metadata to all nodes by default, so you can connect to any node and run queries on your tables.
Running queries from any node is awesome but you also need to be able to monitor and manage your queries from any node. Before, when you only connected the coordinator, using Postgres’ monitoring tools was enough but this is not the case anymore. So in Citus 11 we added some ways to observe your queries similar to you would do in a single Postgres instance.
In this blogpost you’ll learn about some new monitoring tools introduced in Citus 11 that’ll help you track and take control of your distributed queries, including:
- New global PID for Citus
- New citus_stat_activity view
- Updated citus_dist_stat_activity view
- Updated citus_lock_waits view
- Cancel a query from any node with pg_cancel_backend
- Even more helper functions
New identifier for Citus processes: Global PID
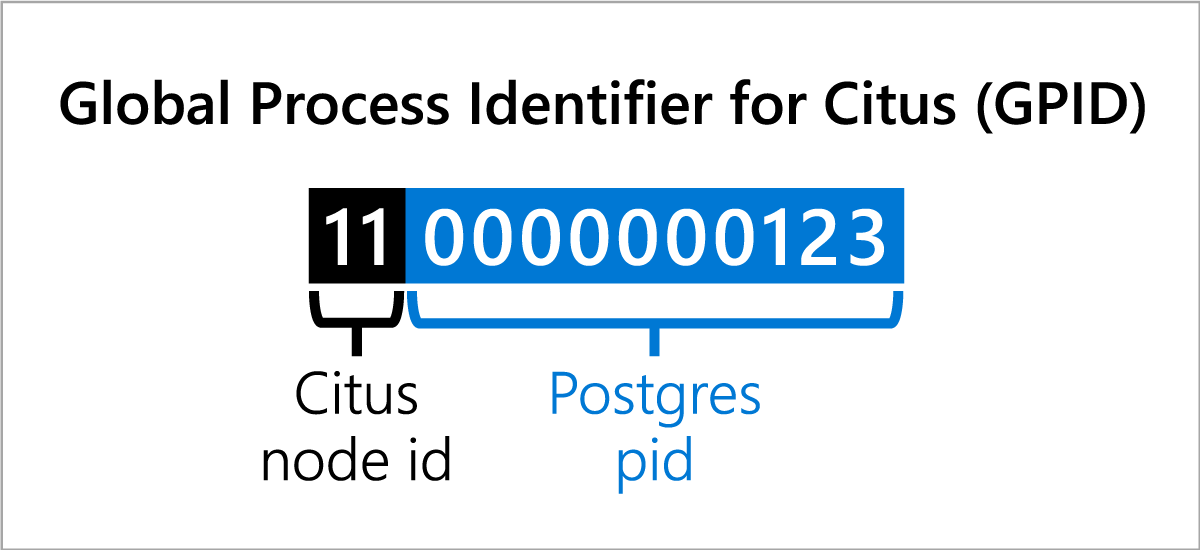
You can now use the Citus global process id, global PID for short, which is new to Citus 11. The Global PID is just like Postgres’ process id, but this new value is unique across a Citus cluster. We call the new value global process identifier and we use global PID or GPID for short.
To find the global PID of your current backend, you can use our new citus_backend_gpid function:
SELECT citus_backend_gpid();
citus_backend_gpid
--------------------
        110000000123
We tried to make GPIDs human readable, so they consist of the Postgres PID of your current backend and the node id of your current node. Smallest 10 digits of global PID are the Postgres process id—which you can find with pg_backend_pid function—and rest of the digits are the node id, which you can find in the pg_dist_node table.
Global PIDs are unique in a Citus cluster. Also, remember that a distributed query might need to run some queries on the shards. Those shard query executions also get the same GPID. In other words, all the activity of a distributed query can be traced via the same GPID. For example, if you run a SELECT query that has the GPID 110000000123, the queries that will SELECT from the shards will also have 110000000123 as global PID.
Note that global PIDs are big integers where Postgres PIDs are 4 byte integers.
New citus_stat_activity view to give you pg_stat_activity views across a Citus cluster
To find the Citus global PIDs and more information about your Postgres queries in a Citus cluster, you can use our new citus_stat_activity view. citus_stat_activity is a collection of pg_stat_activity views from all nodes in the Citus cluster. When you query the citus_stat_activity it goes to every node and gathers pg_stat_activity views. citus_stat_activity includes all the columns from pg_stat_activity and we added three extra columns:
- global_pid: Citus global process id associated with the query.
- nodeid: Citus node id of the node the
citus_stat_activityrow comes from - is_worker_query: Boolean value, showing if the row is from one of the queries that run on the shards.
Let’s say you have a distributed table tbl with 4 shards and you run an update query on it in a node:
BEGIN;
UPDATE tbl SET b = 100 WHERE a = 0;
You can connect to any node and use citus_stat_activity to find info about the UPDATE query.
SELECT global_pid, nodeid, is_worker_query, query
FROM citus_stat_activity
WHERE global_pid = 110000000123;
-[ RECORD 1 ]---+----------------------------------------------------------------------------
global_pid      | 110000000123
nodeid          | 11
is_worker_query | f
query           | UPDATE tbl SET b = 100 WHERE a = 0;
-[ RECORD 2 ]---+----------------------------------------------------------------------------
global_pid      | 110000000123
nodeid          | 2
is_worker_query | t
query           | UPDATE public.tbl_102009 tbl SET b = 100 WHERE (a OPERATOR(pg_catalog.=) 0)
In the output above, you can see:
- record 1 is the original query that we ran on node with
nodeid11 - record 2 is the query that runs on the shard from node with
nodeid2 - both records have the same
global_pid is_worker_querycolumn istruefor record 2 andfalsefor the original query, record 1.
Don’t forget, citus_stat_activity includes all the columns of pg_stat_activity, not just the ones we filter for demonstrating here. So, you can find much more information in citus_stat_activity view.
Use citus_dist_stat_activity view to get summarized info on your queries
If you are not interested in every single query from all the nodes in the Citus cluster and only care about the original distributed queries you can use citus_dist_stat_activity view.
citus_dist_stat_activity hides the queries that run on the shards from the citus_stat_activity view, so you can find some high level information about your Postgres queries.
SELECT global_pid, nodeid, is_worker_query, query
FROM citus_dist_stat_activity
WHERE global_pid = 110000000123;
-[ RECORD 1 ]---+--------------------------
global_pid      | 110000000123
nodeid          | 11
is_worker_query | f
query           | UPDATE tbl SET b = 100 WHERE a = 0;
As, you might have guessed citus_dist_stat_activity is citus_stat_activity filtered with is_worker_query = false. We created citus_dist_stat_activity because when you are interested in the process as a whole and not each and every process on the shards, then the general information that citus_dist_stat_activity provides about the initial queries should be enough.
Find blocking processes with citus_lock_waits view
When something in your Postgres database is blocked you are in the need of monitoring the most. Citus 11 has you covered when your cluster is blocked too. The newly updated citus_lock_waits shows the queries in your cluster that are waiting for some lock on another query.
Let’s say you run a DELETE query on the tbl that will be blocked on the previous UPDATE query:
DELETE FROM tbl WHERE a = 0;
You can connect to any node and use citus_lock_waits to find out which query is blocking your new query:
SELECT * FROM citus_lock_waits;
-[ RECORD 1 ]-------------------------+-----------------------------
waiting_gpid                          | 20000000345
blocking_gpid                         | 110000000123
blocked_statement                     | DELETE FROM tbl WHERE a = 0;
current_statement_in_blocking_process | UPDATE tbl SET b = 100 WHERE a = 0;
waiting_nodeid                        | 2
blocking_nodeid                       | 11
The result above shows the UPDATE statement is blocking the DELETE statement.
Once you find the blocking queries you can use citus_stat_activity and citus_dist_stat_activity with the global PIDs from citus_lock_waits to gather more insight.
Cancel a Postgres query from any Citus node with pg_cancel_backend
After you find out and get more information about the blocking and blocked queries you might decide you need to cancel one of them. Before Citus 11 you needed to go to the node that the query is being run on, and then use pg_cancel_backend with the process id to cancel.
Now in Citus 11 we override the pg_cancel_backend function to accept global PIDs too.
So, good news, things are now easier, you can cancel queries on your Citus clusters from any node:
SELECT pg_cancel_backend(20000000345);
will cause:
DELETE FROM tbl WHERE a = 0;
ERROR:  canceling statement due to user request
Remember that global PIDs are always big integers and Postgres PIDs are 4-byte integers. The difference in size is how pg_cancel_backend differentiates between a PID and a GPID.
Also, like pg_cancel_backend, Citus 11 overrides pg_terminate_backend to accept global PIDs too. So, you can also terminate queries from different nodes using global PIDs.
More helper functions
In addition to all the Citus activity and lock views mentioned, we added some more smaller functions to help you monitor your database cluster. The new functions try to make it easier for you to get some info that can be useful when writing monitoring queries, including:
Get nodename and nodeport information
You can use citus_nodename_for_nodeid and citus_nodeport_for_nodeid to get info about the node with a node id:
SELECT citus_nodename_for_nodeid(11);
 citus_nodename_for_nodeid
---------------------------
 localhost

SELECT citus_nodeport_for_nodeid(11);
 citus_nodeport_for_nodeid
---------------------------
                      9701
You can find both info above in the pg_dist_node table too.
Parse the GPID into nodeid and Postgres pid components
You can use citus_nodeid_for_gpid and citus_pid_for_gpid to parse a GPID.
SELECT citus_nodeid_for_gpid(110000000123);
 citus_nodeid_for_gpid
-----------------------
                     11

SELECT citus_pid_for_gpid(110000000123);
 citus_pid_for_gpid
--------------------
                123
As I mentioned earlier, we tried to make GPIDs human readable and with the two functions above they are also easily machine readable too.
With the functions above you can find out about a node from a GPID like this:
SELECT citus_nodename_for_nodeid(citus_nodeid_for_gpid(110000000123)),
citus_nodeport_for_nodeid(citus_nodeid_for_gpid(110000000123));
citus_nodename_for_nodeid | citus_nodeport_for_nodeid
---------------------------+---------------------------
localhost                 |                      9701
(1 row)
Use citus_coordinator_nodeid to find the coordinator’s node id
Finally, you can use citus_coordinator_nodeid to find the node id of the coordinator node.
SELECT citus_coordinator_nodeid();
 citus_coordinator_nodeid
--------------------------
                        3
With Citus 11 you can monitor from any node in a Citus database cluster
With Citus 11 you can query your distributed Postgres tables from any node by default. And with the tools you learned about in this blog post, you know how to monitor and manage your Citus cluster from any node, like you would do with a single Postgres instance.
If you’re interested in all that changed in Citus 11 check out:
- Marco’s Citus 11 blog post, titled: Citus 11 for Postgres goes fully open source, with query from any node
- Citus 11.0 updates page
- Recording of the Citus 11 release party, our first livestream release party with demos of several of the new features
And if you want to download Citus you can always find the latest download instructions on the website; we’ve put together lots of useful resources on the Getting Started page; you can file issues in the GitHub repo; and if you have questions please join us (and other users in the community) in the Citus Public Slack.