POSETTE 2024 is a wrap! 💯 Thanks for joining the fun! Missed it? Watch all 42 talks online 🍿
Update: In 2020, our Citus open source team rolled out a single query executor that can handle different types of Postgres workloads and solves all the shortcomings of the real-time and router executor in a single unified code path: the Citus adaptive executor. The Citus adaptive executor uses a dynamic pool of connections to each worker node to execute Postgres queries on the shards (SQL tasks)—and replaces the previous real-time executor discussed in this blog post. You can learn all about the Citus adaptive executor in Marco Slot’s newer blog post: How the Citus distributed query executor adapts to your Postgres workload.
Citus has multiple different executors which each behaving differently to support a wide array of use cases. For many the notion distributed SQL seems like it has to be a complicated one, but the principles of it aren't rocket science. Here we're going to look at a few examples of how Citus takes standard SQL and transforms it to operate in a distributed form so it can be parallelized. The result is that you can see speed up of 100x or more in query performance over a single node database.
How do we know something is distributed vs. single shard?
Before we get to how the real-time executor works it is worth a refresher on Citus executors in general.
When Citus receives query we first look to see if it has the shard key also known as distribution column as part of the where clause. If you're sharding a multi-tenant app such as a CRM application you may have an org_id which you're always limiting queries on. In that case as long as org_id is part of your where clause we know it's targetting a single shard, and thus use the router executor. If that's not being used we split the query up and send it to all shards in parallel across nodes.
As a quick refresher a shard within Citus is another table. If you a table events and you want to distribute that, you could create 32 shards, this means we could easily scale up to 32 nodes. If you're starting with 2 nodes, then each node contains 32 shards. This means that each node will receive 16 queries at once, and if it has 16 cores available all that work will be done in parallel resulting in a 2 node x 16 core, or rather 32x speed up as opposed to executing on a single core.
For our examples later on we're going to create only 4 shards to simplify them a bit, but things scale nearly linearly the more shards and cooresponding cores you add.
Writing in SQL, thinking in MapReduce
Citus' support for real-time analytics is a workload that people used Citus for since our early days, thanks to our advanced query parallelization. The result is you are able to express things in standard SQL and let Citus' distributed query planner do the hard work of re-writing queries to give you great performance without having to create a convoluted ball of engineering duct tape.
Digging into some examples, starting with count(*)
The simplest query that we can start to tackle is count(*). For count(*) we need to get a count(*) from each of our shards. Let's start by running an explain plan against our events table to see how it'll operate:
                                              QUERY PLAN
-------------------------------------------------------------------------------------------------------
 Aggregate  (cost=0.00..0.00 rows=0 width=0)
   ->  Custom Scan (Citus Real-Time)  (cost=0.00..0.00 rows=0 width=0)
         Task Count: 4
         Tasks Shown: One of 4
         ->  Task
               Node: host=ec2-18-233-232-9.compute-1.amazonaws.com port=5432 dbname=citus
               ->  Aggregate  (cost=11.62..11.63 rows=1 width=8)
                     ->  Seq Scan on events_102329 events  (cost=0.00..11.30 rows=130 width=0)
(8 rows)

Time: 160.596 ms
There are a few things to notice within the query. The first is that it's using the Citus Real-Time executor, this mean the query is hitting all shards. The second is that the task is one of 4. The task is most commonly the same across all nodes, but because it's pure Postgres plans can change based on the data distribution and estimates. If you want to see the query plan for all you can expand the output to get tasks for all 4 shards. Finally, you have the query plan itself for that specific shard.
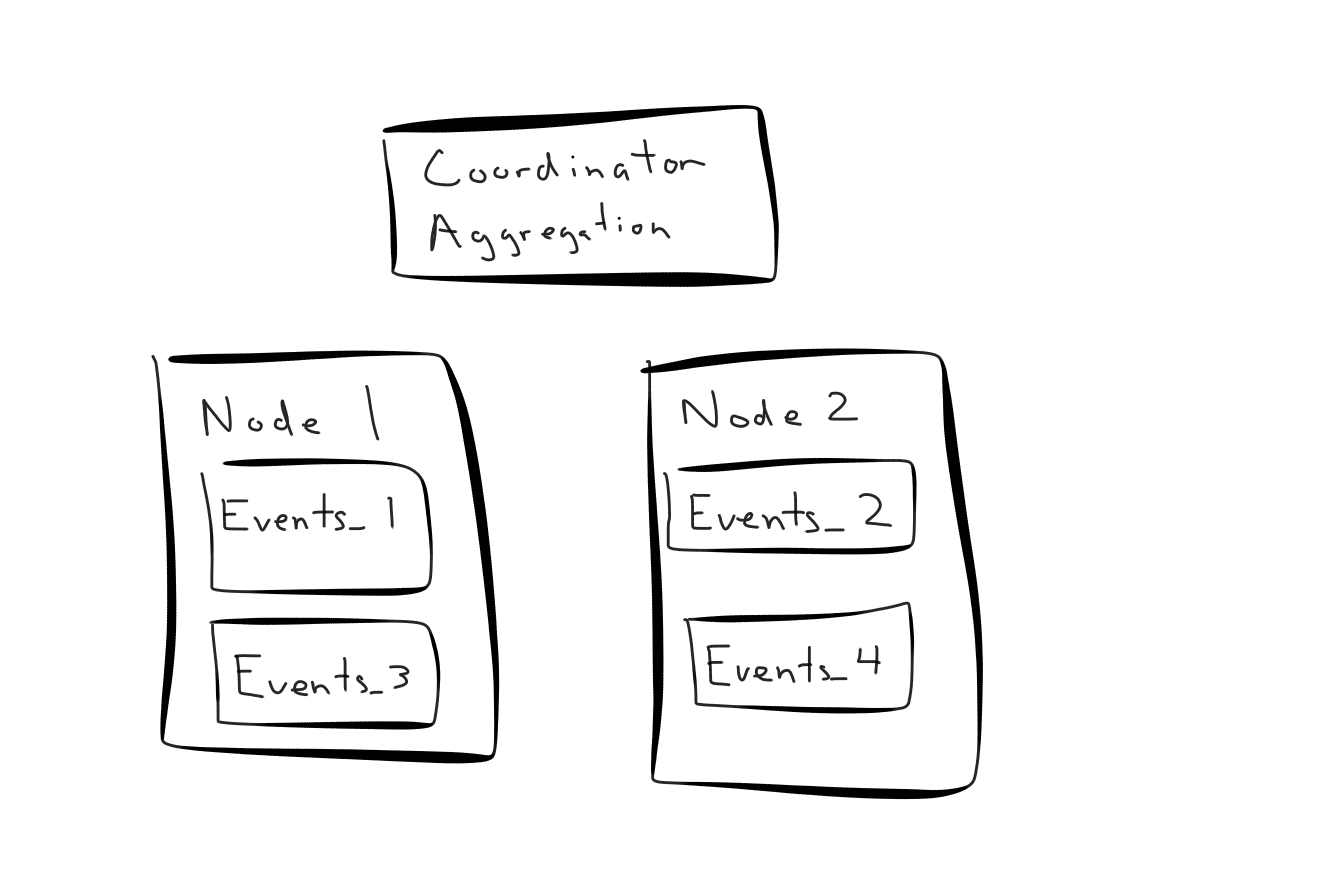
Let's take an example cluster:

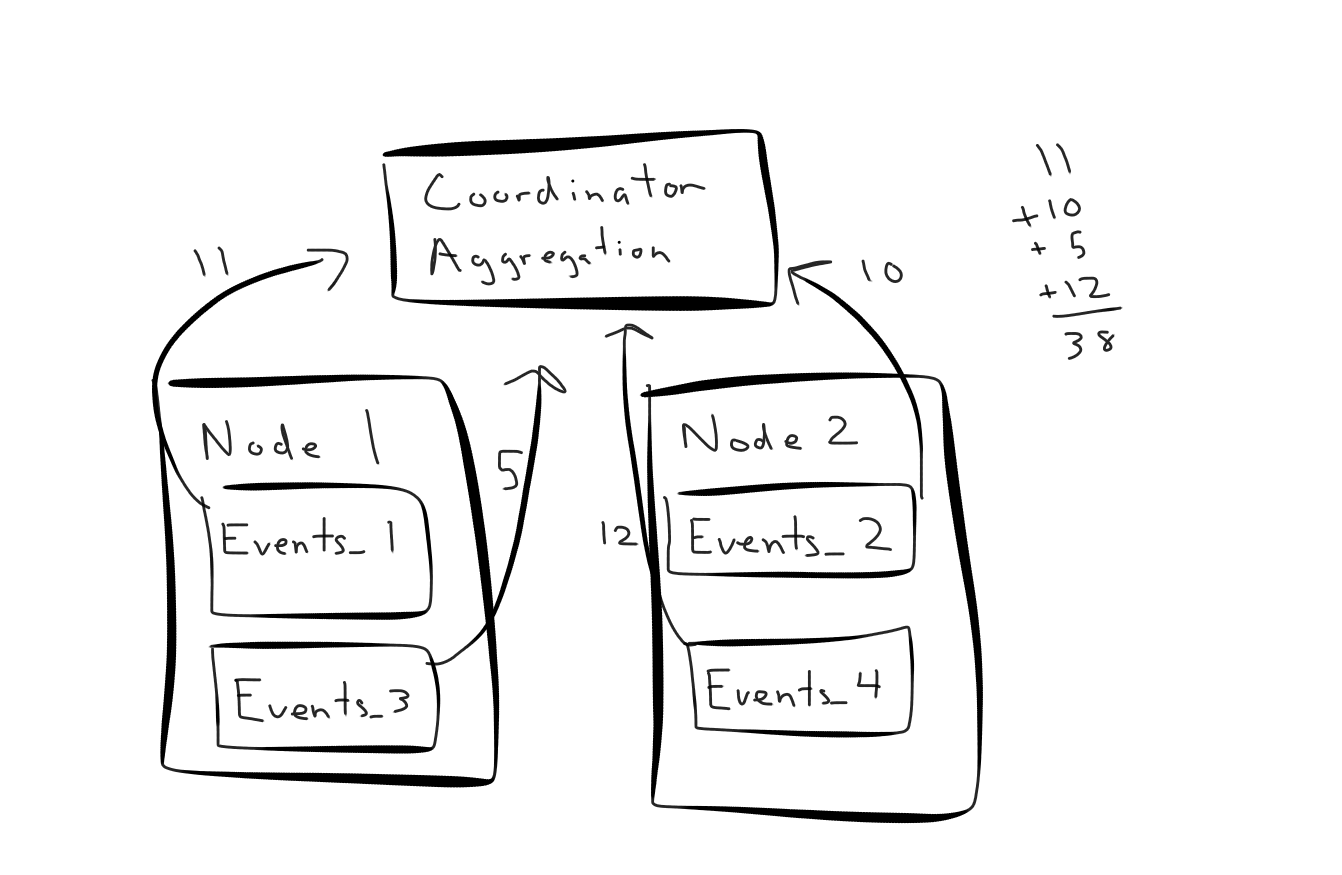
If we were to execute a count(*) against this cluster Citus would re-write the query and send four count(*) queries to each shard. The resulting counts then come back to the coordinator to perform the final aggregation:

Performing much more than count(*)
While count(*) is easy to see how this would work you can do many more operations beyond that. If you were to get four averages and average them together you don't actually get the resulting average. Instead for average Citus will perform a sum(foo) and count(foo) then on the coordinator we divide sum(foo) / count(foo) to give you the correct result. The best part of this you can still write AVG and Citus takes care of the underlying complexing.
Going even further than aggregates, Citus also can tell when you're joining and perform those joins locally. Let's add another table to our events table: sessions. Now for each event we'll record the session id as part of it so we can join to it. With these two tables we now want a query that will tell us the average number of events for a session, for sessions that were created in the past week:
SELECT count(events.*),
       count(distinct session_id)
FROM events,
     sessions
WHERE sessions.created_at >= now() - '1 week'::interval
  AND sessions.id = events.session_id
Here with both tables distributed on session id Citus will know these tables are colocated. With colocated tables Citus will re-write the query to push the join down locally to not send as much data over the wire. The result is we'll get 2 records sent back to the coordinator from each shard instead of all the raw data, resulting in significantly improved analytical query time. The re-written internally might look something like:
SELECT count(events_01.*),
       count(distinct session_id)
FROM events_01,
     sessions_01
WHERE sessions_01.created_at >= now() - '1 week'::interval
  AND sessions_01.id = events_01.session_id

SELECT count(events_02.*),
       count(distinct session_id)
FROM events_02,
     sessions_02
WHERE sessions_02.created_at >= now() - '1 week'::interval
  AND sessions_02.id = events_02.session_id

...
Distributed SQL doesn't have to be hard, but it sure can be fast
The beauty of pushing down joins and parallelization is:
- You don't have to send as much data over the network, which is slower than scanning in memory
- You can leverage all cores in your system at once as opposed to a query running on a single core
- You can outgrow the limits of how many memory/cores you can cram into a single machine
Hopefully this tour of the Citus real-time executor simplifies a bit of how things work under the covers. If you want to dive in deeper consider taking a read through our docs.
