📺 All 44 POSETTE: An Event for Postgres 2026 talks are now available on YouTube.
Getting an example schema and data is often one of the more time consuming parts of testing a database. To make that easier for you, we're going to walk through Citus with an open data set which almost any developer can relate to–github event data. If you already have your own schema, data, and queries you want to test with, by all means use it. If you need any help with getting setup, join us in our Slack channel and we'll be happy to talk through different data modeling options for your own data.
An overview of the schema and queries
The data model we're going to work with here is simple, we have users and events. An event can be a fork or a commit related to an organization and of course many more.
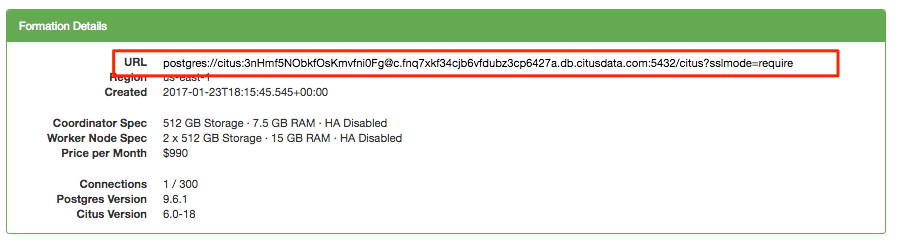
To get started we're going to login to Citus Cloud and provision a production cluster. You can absolutely use the dev plan which only costs ~ $3 a day, but in this case we're going to use the production instance so we can easily resize it towards the ends. Once you've provisioned your cluster you can connect to it with your standard Postgres psql:
psql postgres://citus:3nHmf5NObkfOsKmvfni0Fg@c.fnq7xkf34cjb6vfdubz3cp6427a.db.citusdata.com:5432/citus?sslmode=require
Now we're going to set up our two tables.
CREATE TABLE github_events
(
    event_id bigint,
    event_type text,
    event_public boolean,
    repo_id bigint,
    payload jsonb,
    repo jsonb,
    user_id bigint,
    org jsonb,
    created_at timestamp
);

CREATE TABLE github_users
(
    user_id bigint,
    url text,
    login text,
    avatar_url text,
    gravatar_id text,
    display_login text
);
On the payload field of events we have a JSONB datatype. JSONB is the JSON datatype in binary form in Postgres. This makes it easy to store a more flexible schema in a single column and with Postgres we can create a GIN index on this which will index every key and value within it. With a GIN index it becomes fast and easy to query with various conditions directly on that payload. So we'll go ahead and create a couple of indexes before we load our data:
CREATE INDEX event_type_index ON github_events (event_type);
CREATE INDEX payload_index ON github_events USING GIN (payload jsonb_path_ops);
Next we’ll actually take those standard Postgres tables and tell Citus to shard them out. To do so we’ll run a query for each table. With this query we’ll specify the table we want to shard, as well as the key we want to shard it on. In this case we’ll shard both the events and users table on user_id:
SELECT create_distributed_table('github_events', 'user_id');
SELECT create_distributed_table('github_users', 'user_id');
Now we're ready to load some data. You can download the two example files users.csv and events.csv. We also have a large_events.csv available, which may be more interesting to try out, though admittedly takes longer to download and load. Once downloaded connect with psql and load the data with \copy:
\copy github_events from events.csv CSV;
\copy github_users from users.csv CSV;
Querying
Now we're all setup for the fun part, actually running some queries. Let's start with something really basic. A simple count (*) to see how much data we loaded:
SELECT count(*) from github_events;
 count
--------
 126245
(1 row)

Time: 177.491 ms
So a nice simple count works. We'll come back to that sort of aggregation in a bit, but for now let’s look at a few other queries. Within the JSONB payload column, we've got a good bit of data, but it varies based on event type. For a PushEvent type there is a size associated with it which includes the number of distinct commits in each push. With this we could perform something like the total number of commits per hour:
SELECT date_trunc('hour', created_at) AS hour,
       sum((payload->>'distinct_size')::int) AS num_commits
    FROM   github_events
    WHERE  event_type = 'PushEvent'
    GROUP BY hour
    ORDER BY hour;
        hour         | num_commits
---------------------+-------------
 2016-12-01 05:00:00 |       22160
 2016-12-01 06:00:00 |       53562
 2016-12-01 07:00:00 |       46540
 2016-12-01 08:00:00 |       35002
(4 rows)

Time: 186.176 ms
But we also had our users table. Since we sharded both users and events on the same id it means that data is co-located together and can easily be joined. In certain cases, like for multi-tenant data models you'll find sharding on a tenant_id makes scaling out quite straight-forward. If we join on the user_id it should pass down to all the distributed shards without us having to do any extra work. An example of something we may want to do with this, is to find the users who created the most repositories:
SELECT login, count(*)
FROM github_events ge
JOIN github_users gu
ON ge.user_id = gu.user_id
WHERE event_type = 'CreateEvent' AND
payload @> '{"ref_type": "repository"}'
GROUP BY login
ORDER BY count(*) DESC;
             login              | count
---------------------------------+-------
 atomist-test-web                |    60
 isisliu                         |    60
 atomist-web-test-staging        |    55
 direwolf-github                 |    50
 circle-api-test                 |    40
 uncoil                          |    23
 kvo91                           |    14
 ranasarikaya                    |    10
 Alexgallo91                     |     9
 marcvl                          |     9
 Joshua-Zheng                    |     8
 ...
Scaling out
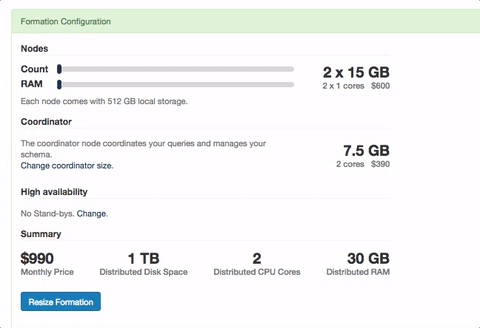
One of the major benefits of Citus, is that when you need to, you can scale out your database as opposed to scaling up. This means a more horizontal path to scaling your database and you won't run into some ceiling of the largest instance you can find. Of course there are a few other benefits to scaling out as opposed to up as well. When you do need to scale out, on Citus Cloud it's as simple as going to the settings and resizing your formation. Once you change your size and it takes effect, you then need to rebalance your data so it's distributed across all nodes.
First let's look to see how the data resides:
SELECT nodename, count(*)
FROM pg_dist_shard_placement
GROUP BY nodename;
                 nodename                 | count
------------------------------------------+-------
 ec2-34-198-9-41.compute-1.amazonaws.com  |    32
 ec2-34-198-11-52.compute-1.amazonaws.com |    32
(2 rows)

Time: 83.659 ms
As you can see there is an equal number of shards on each node
Now let's hop back into the console in our settings area and resize the cluster. To do this login to Citus Cloud, click on the settings tab and hit resize. You'll now see the slider that allows you to resize your cluster, scale to what you desire and click Resize. Give it a few minutes and all your nodes will now be available.
But, nothing has changed to your data. To begin taking effect of your new nodes you'll want to run the rebalancer. When you run the rebalancer we move shards from one physical instance to another so your data is more evenly distributed. As this happens, writes continue to flow as normal and writes are held at the coordinator. Once the operation completes those writes on the coordinator continue to flow through. This means no reads were delayed and no writes were lost throughout the entire operation. Even better, for multi-tenant apps we move all co-located shards in concert with each other so joins between them continue to operate as you'd expect.
Now, let's run the rebalancer. When you run it you'll see output for each shard that is moved from one node to another:
SELECT rebalance_table_shards('github_events', 0.0);
NOTICE:  00000: Moving shard 102072 from ec2-34-198-11-52.compute-1.amazonaws.com:5432 to ec2-34-197-198-188.compute-1.amazonaws.com:5432 ...
CONTEXT:  PL/pgSQL function rebalance_table_shards(regclass,real,integer,bigint[]) line 63 at RAISE
LOCATION:  exec_stmt_raise, pl_exec.c:3165
NOTICE:  00000: Moving shard 102073 from ec2-34-198-9-41.compute-1.amazonaws.com:5432 to ec2-34-197-247-111.compute-1.amazonaws.com:5432 ...
CONTEXT:  PL/pgSQL function rebalance_table_shards(regclass,real,integer,bigint[]) line 63 at RAISE
LOCATION:  exec_stmt_raise, pl_exec.c:3165
NOTICE:  00000: Moving shard 102074 from ec2-34-198-11-52.compute-1.amazonaws.com:5432 to ec2-34-197-198-188.compute-1.amazonaws.com:5432 ...
...
Now we can re-run the query to show us all the shard placements and see our new even distribution of shards:
SELECT nodename, count(*)
FROM pg_dist_shard_placement
GROUP BY nodename;
                  nodename                  | count
--------------------------------------------+-------
 ec2-34-197-198-188.compute-1.amazonaws.com |    16
 ec2-34-198-9-41.compute-1.amazonaws.com    |    16
 ec2-34-198-11-52.compute-1.amazonaws.com   |    16
 ec2-34-197-247-111.compute-1.amazonaws.com |    16
(4 rows)
And with this we can go back to our count (*) query as well. Now that we've doubled the resources in our cluster, queries that can be parallelized will be performed much faster. Running our basic count (*) query we'll see that the query time is now nearly half of what it was before:
SELECT count(*) from github_events;
 count
--------
 126245
(1 row)

Time: 97.792 ms
Get started today
If you're in need of a dataset to give Citus a try, this example data from GitHub should help.
This post originated from one of our solution engineer's, Samay Sharma. He performs many demos to customers to highlight how Citus works. If you're interested in a private demo run through or want help trying Citus with your own data then contact us.