The schedule is out 🗓️ for POSETTE: An Event for Postgres 2026!
At the heart of most applications is a database. Ensuring your database is performing well is key to ensuring your your customers receive a good experience when working with your app. It's likely you're already monitoring your systems today, and want to monitor your database using similar tooling. Today we're excited to release turnkey integration for one of the more popular tools out there to monitor Citus Cloud clusters: Datadog.
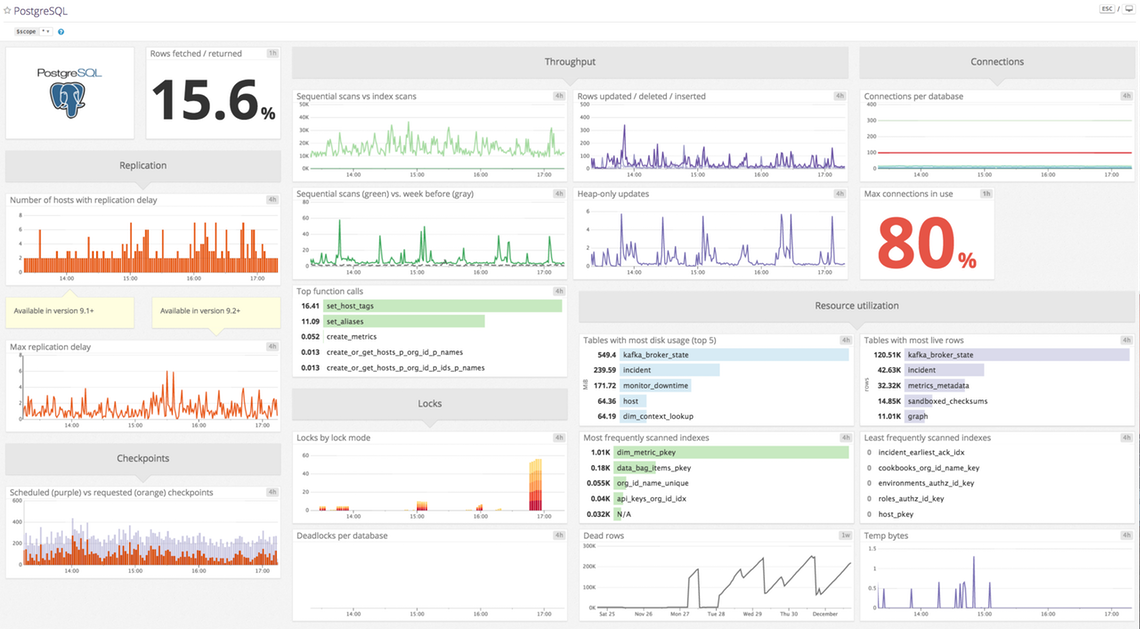
With our Datadog integration you can get a number of key stats on your database that will allow you to easily monitor and alert before issues arise. Some of the key metrics you'll start receiving insight into once you set up your integration are:
- Disk usage
- Load average
- Locks
- Connection information, including pgbouncer

Setup your Datadog monitoring
To setup your Datadog to receive stats for your Citus Cloud cluster you'll first want to capture your API key from your Datadog account. Then you'll follow these steps:
- Launch a linux server you'll be using for the Datadog agent
- Install the Datadog agent to that server. This program will listen for input and then send it to Datadog. You can set this up with:
# substitute your own API key
DD_API_KEY=1234567890 bash -c \
  "$(curl -L https://raw.githubusercontent.com/DataDog/datadog-agent/master/cmd/agent/install_script.sh)"
- Configure the agent. As an example:
cat - | sudo tee -a /etc/datadog-agent/datadog.yaml << CONF
non_local_traffic: yes
use_dogstatsd: yes
dogstatsd_port: 8125
dogstatsd_non_local_traffic: yes
log_level: info
log_file: /var/log/datadog/agent.log
CONF
# this is how to do it on ubuntu
sudo systemctl restart datadog-agent
- Fill in the agent server information as a new metrics destination in the Cloud Console. See the previous section for details.
- The agent should now appear in the Infrastructure section in Datadog.
If you have more questions about setting up your Datadog integration check out our docs, or open a ticket with us.
More than just Datadog
Datadog is one of the major providers when it comes to monitoring your systems, and we already have customers leveraging our Datadog integration today. But it's not the only, in order to allow you more flexibility you can get your logs directly via statsd and parse yourself or send to other providers.
